Viewing the NAA through functions
I’ve mapped current RecordSearch functions onto the top-level functions in AGIFT3. This was necessary because the functions in RecordSearch are a bit of a mess, with top-level functions added for no discernable reason. That left me with 23 groups of functions.
I then found the agencies that performed these functions, and the series that the agencies created while they were performing these functions. I made sure a series only appeared once within each function group. I then added up the quantity of records (in shelf metres), the number of items described, and the number of items digitised, for every series associated with a function group. I ended up with the following results.
| Top-level function | Number of series | Quantity (shelf metres) | Items described | Items digitised |
|---|---|---|---|---|
| BUSINESS SUPPORT AND REGULATION | 963 | 8675.33 | 116158 | 2055 |
| CIVIC INFRASTRUCTURE | 5388 | 47406.29 | 853097 | 171925 |
| COMMUNICATIONS | 5453 | 24371.09 | 1271196 | 315297 |
| COMMUNITY SERVICES | 4088 | 58396.02 | 623815 | 98434 |
| CULTURAL AFFAIRS | 2246 | 27577.09 | 691001 | 65752 |
| DEFENCE | 9470 | 40625.71 | 3025744 | 906566 |
| EDUCATION AND TRAINING | 1907 | 7853.72 | 540258 | 66448 |
| EMPLOYMENT | 3464 | 15280.48 | 337180 | 167817 |
| ENVIRONMENT | 871 | 4476.42 | 163550 | 6356 |
| FINANCE MANAGEMENT | 4086 | 16012.76 | 549137 | 111586 |
| GOVERNANCE | 8016 | 30016.31 | 1144169 | 207320 |
| HEALTH CARE | 1839 | 8718.94 | 76632 | 5886 |
| IMMIGRATION | 2431 | 44565.01 | 2645768 | 280336 |
| INDIGENOUS AFFAIRS | 1514 | 29029.37 | 915105 | 97448 |
| INTERNATIONAL RELATIONS | 2762 | 22879.45 | 1561377 | 162277 |
| JUSTICE ADMINISTRATION | 2819 | 20465.67 | 1560340 | 114005 |
| NATURAL RESOURCES | 1942 | 8746.27 | 357485 | 71926 |
| PRIMARY INDUSTRIES | 2293 | 8546.23 | 366128 | 65912 |
| SCIENCE | 4881 | 29146.20 | 726435 | 174210 |
| SECURITY | 2449 | 21649.89 | 1988034 | 442256 |
| SPORT AND RECREATION | 496 | 2047.91 | 33462 | 2873 |
| TRADE | 5015 | 23146.42 | 2101005 | 270862 |
| TRANSPORT | 6351 | 34264.29 | 1053470 | 233459 |
Of course there are numerous problems with this data. Perhaps most importantly, not all records in a series will be associated with the perfomance of a particular function. But short of harvesting the whole of RecordSearch, I think it provides a reasonable starting point. I’m also still not sure that I’ve found all of the functions that are currently in use. As I was preparing this data, I noticed that some ‘unpreferred’ terms are nonetheless being used. Sigh. So expect further updates…
Anyway, here’s a first attempt to plot the results. You can see how functions such as ‘Defence’, ‘Immigration’, and ‘Security’, are described and digitised at a much higher rate than other areas.
I thought I’d make a quick attempt to see how the the holdings of the National Archives look when viewed through these different dimensions, so I created some basic wordclouds.
The NAA by quantity (shelf metres)
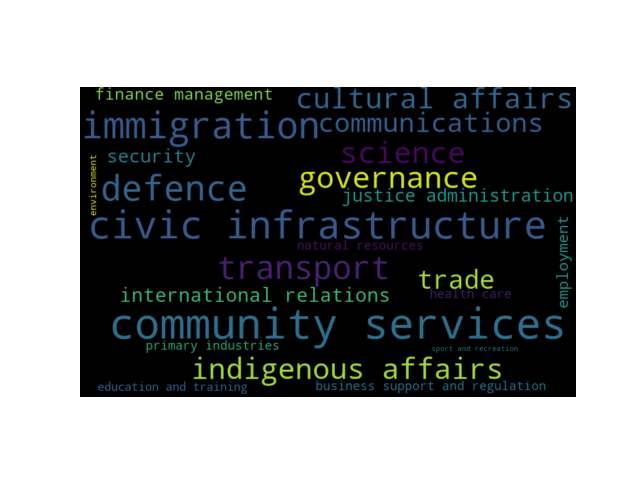
The NAA by number of items described

The NAA by number of items digitised

Of course the point of all this is to explore how decisions around things like description and digitisation change what we ‘see’. More about that soon…
